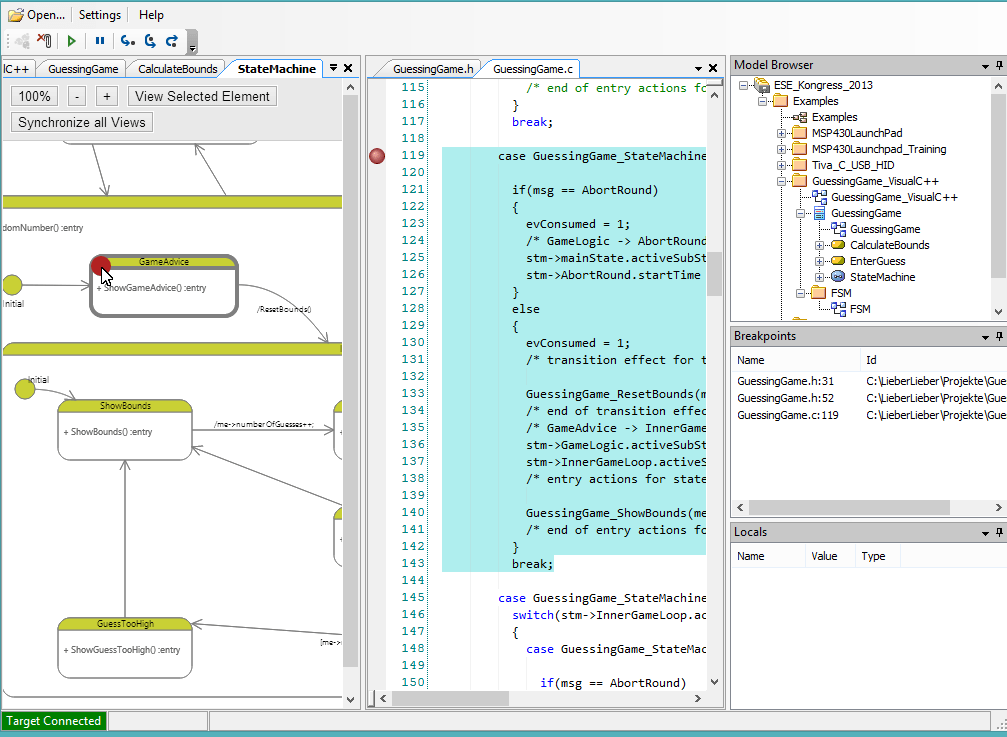
enar uml debugger is a graphical UML debugger which works with models created in Sparx Systems Enterprise Architect. Our goal was to provide you with a tool for debugging software modeled in UML or SysML right at the model layer. When push comes to shove, you can always continue with traditional source level debugging without losing the link to the model.
enar uml debugger is part of our product chain targeting software development for embedded systems and is based on enar uml2code, our code generator, developed to generate platform independent code from UML state machines and activity models.
You can debug the generated code in conjunction with your favorite IDE. We already support various embedded environments and debugger:
- Green Hills MULTI
- iSYSTEM winIDEA
- PLS UDE
- Lauterbach Trace32
- Microsoft Visual Studio 2010, 2012, 2013
Below overview of the most important features…
- Support for EAP and XMI files.
You can open and browse through your model directly in the UML Debugger.
Watch Video
- Synchronous Highlighting of Model Elements and Source Code.
Select an UML element in the project browser, the source code generated for the element will be automatically highlighted.
Watch Video
- Setting Breakpoints in UML Diagrams. Supports Hardware Breakpoints!
Set breakpoints and step trough on design level in the diagrams you developed.
Watch Video
- Setting Breakpoints in the Source Code.
You can set a breakpoint just as you would with traditional C-level debugging in the source code and it will be visualized also on the corresponding UML element.
Watch Video
- Debugging Generated Code on the C-language Level.
You can also step through the generated source code while debugging if desired.
Watch Video
- Debugging Code which wasn’t generated by enar uml2code.
If you jump into the source code which wasn’t generated, just continue debugging as usual.
Watch Video
- Displaying Values of Variables and Class Attributes.
You can monitor the variables directly in our UML Debugger and have no need to switch applications
Watch Video
If you have feedback or new ideas – you are welcome, we are looking forward for your comments!
Recent Comments